Review Article | | Peer-Reviewed

The Role of Myelogram in the Diagnosis of Myelodysplastic Neoplasms

Received: 13 February 2026     Accepted: 2 March 2026     Published: 23 March 2026
Views:       Downloads:
Abstract

Myelodysplastic syndromes (MDS) constitute a heterogeneous group of clonal hematopoietic stem cell disorders, characterized by ineffective hematopoiesis, peripheral cytopenias, and a risk of progression to acute leukemia. We report the results of a retrospective descriptive study of 100 MDS cases diagnosed at the hematology laboratory of HMIMV in Rabat over a 7-year period (January 2018 to December 2024), using a standardized data collection form for epidemiological, clinical, and biological data. The main objective of this work was to analyze the diagnostic contribution of bone marrow examination in MDS, specifying its indications and the main abnormalities observed. The mean age at diagnosis was 69 years (range: 41-93 years), with a moderate male predominance (sex ratio = 1.38). Clinically, anemic syndrome was the most frequent presenting manifestation (70%), followed by hemorrhagic manifestations (12%) and infectious manifestations (10%). Biological analysis revealed anemia in 90% of patients (mean hemoglobin: 9 g/dL), thrombocytopenia in 63% of cases, and leukopenia in 42% of cases. The anemia was normocytic in 55.6% of cases, macrocytic in 33.3%, and microcytic in 11.1%. Bone marrow examination revealed dyserythropoiesis in 92% of patients, dysgranulopoiesis in 65% of cases, and dysmegakaryopoiesis in 45% of cases. The median percentage of bone marrow blasts was 4.89%. According to the 2016 WHO classification, MDS-MLD were the most frequent (48%), followed by MDS-EB1 (21%) and MDS-EB2 (12%). The results of this study are consistent with national and international literature data, confirming the central role of bone marrow examination in MDS diagnosis and highlighting the importance of a multidisciplinary approach for optimal management of these complex hematological malignancies.

Published in European Journal of Clinical and Biomedical Sciences (Volume 12, Issue 2)
DOI 10.11648/j.ejcbs.20261202.11
Page(s) 17-26
Creative Commons

This is an Open Access article, distributed under the terms of the Creative Commons Attribution 4.0 International License (http://creativecommons.org/licenses/by/4.0/), which permits unrestricted use, distribution and reproduction in any medium or format, provided the original work is properly cited.

Copyright

Copyright © The Author(s), 2026. Published by Science Publishing Group

Keywords

Myelogram, Myelodyplastic Neoplasm, Diagnosis, WHO Classification

1. Introduction
The myelogram is an essential cytological examination used to analyze hematopoietic precursor cells in the bone marrow. Despite its longstanding use, it remains a cornerstone of clinical hematology , particularly for the diagnosis, staging, and monitoring of hematologic diseases. It also guides further investigations such as cytogenetics and molecular biology. Its reliability depends on a well-executed pre-analytical phase, including sample collection, smear preparation, and staining. Interpretation requires an experienced biologist capable of correlating clinical, biological, and morphological data.
The myelogram is often performed in response to abnormalities found in the complete blood count (CBC), with both tests being complementary. Myelodysplastic neoplasms (MDS) are clonal hematologic disorders commonly seen in older men, with a median age of 72 years. They result in ineffective hematopoiesis, leading to cytopenia despite a normally cellular marrow. Clinically, they cause fatigue, pallor, infections, fever, bleeding, and bruising. They may progress to acute myeloid leukemia (AML) .
Diagnosis primarily relies on cytological criteria derived from the myelogram. The present study is a retrospective analysis of 100 cases of MDS diagnosed at the Mohammed V Military Hospital in Rabat over a 7-year period (since 2018). Its objectives are to describe the epidemiological profiles, identify the indications for performing a myelogram, analyze observed abnormalities, and establish a classification of MDS.
2. Material and Methods
This retrospective descriptive study involved 100 cases of myelodysplastic neoplasms (MDS), collected at the Hematology Laboratory of the Mohammed V Military Teaching Hospital in Rabat (HMIMV) over a 7-year period [2018–2024]. It included patients over 18 years of age, whether hospitalized or seen as outpatients, who presented with myelograms suggestive of MDS.
The analysis was based on the results of both myelograms and associated complete blood counts (CBCs), which were systematically performed together. CBCs were conducted using the Sysmex XN-3100 analyzer on blood samples collected in EDTA tubes. Peripheral blood and bone marrow smears were stained using the May-Grünwald-Giemsa (MGG) method.
Each patient was informed about the indication, procedure, and purpose of the myelogram.
Sternal bone marrow aspiration was preferred, with recourse to the iliac crest in certain cases.
Two smear techniques were employed: direct smears and particle crush preparations. Between 5 and 10 slides were prepared, air-dried, and promptly sent to the laboratory, accompanied by clinical and identification documents.
The MGG staining protocol was adjusted to optimize visualization of bone marrow cells.
Smears were examined at low magnification (×10) to assess cellularity and at high magnification (×100) for morphological detail. A lineage was considered dysplastic if more than 10% of its cells exhibited abnormalities.
The percentage of bone marrow blasts was systematically assessed.
Perls’ staining was performed for all patients to detect ring sideroblasts (≥15% of erythroblasts).
Myeloperoxidase staining was used selectively to help identify blast cell lineage.
A diagnostic report was issued based on morphological abnormalities, blast percentage, patient age, and clinical context. Additional tests (karyotyping, molecular biology) were proposed when necessary. MDS diagnosis was based on the 2016 WHO classification criteria.
The study highlights the critical role of the myelogram in the accurate diagnosis of MDS.
3. Results
3.1. Epidemiological Profil
During the study period, from 2018 to 2024, we collected 100 cases of myelodysplastic neoplasm, representing an average annual frequency of 14.3 cases per year. The mean age of patients in our series was 69 years, with a range from 41 to 93 years. Age group distribution showed that myelodysplastic neoplasm primarily affected individuals aged 61–70 and 71–80 years, with 32 cases in each group. The other age groups were less represented, with 6 cases between 41 and 50 years, 13 cases between 51 and 60 years, and 17 cases in patients over 80 years of age (Figure 1).
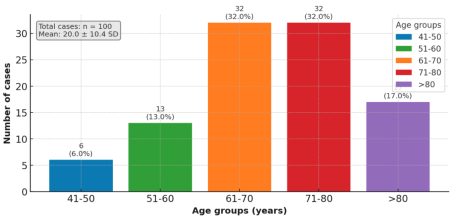
Figure 1. Distribution of MDS cases according to age.
A male predominance was observed among our patients. Out of the entire study population, 58 patients were male (58%) and 42 were female [42%], resulting in a male-to-female sex ratio of 1.38 (Figure 2).
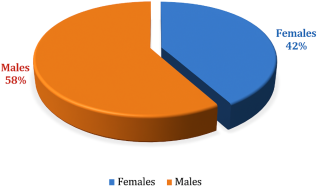
Figure 2. Distribution of MDS cases according to sex (N=100).
The majority of the myelograms were performed on hospitalized patients from various departments, primarily from the Clinical Hematology and Internal Medicine departments, which accounted for 76 and 11 requests respectively. Other hospital departments were less represented: Cardiology (3 requests), Intensive Care (2), Emergency (2), Gynecology (1), and Nephrology (1). Additionally, 4 requests concerned non-hospitalized (outpatient) patients.
3.2. Myelogram Indications
3.2.1. Clinical Indications
In our series, the clinical indications leading to the performance of the myelogram were predominantly related to anemic syndrome, which was found in 70% of patients. Hemorrhagic syndrome was observed in 12% of cases, while an infectious syndrome was noted in 10% of patients. Tumoral syndrome remained rare, accounting for only 3% of cases. Finally, in 5% of situations, the myelogram was performed following the incidental discovery of hematologic abnormalities on the complete blood count, in the absence of suggestive clinical symptoms (Figure 3).
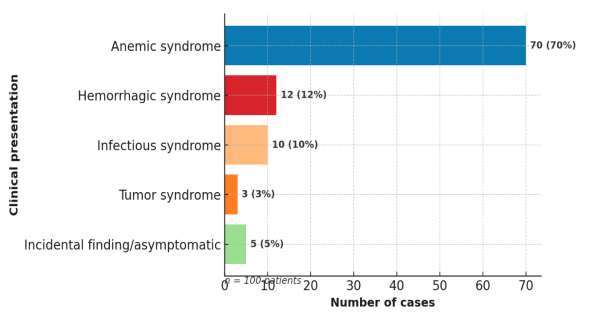
Figure 3. Distribution of clinical indications of myelogram.
3.2.2. Biological Indications
(i). Blood Count Abnormalities
In this study, 90% of patients presented with anemia, with a mean hemoglobin level of 9 g/dL. Among them, 6 patients had levels below 7 g/dL, 54 had levels between 7 and 10 g/dL, and 40 patients had levels above 10 g/dL.
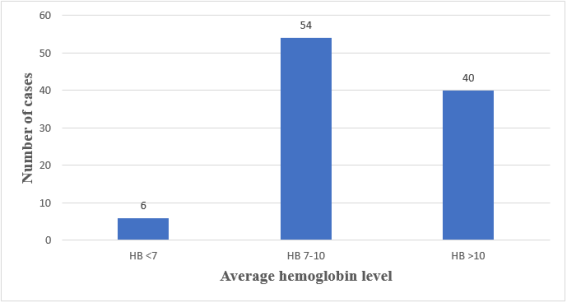
Figure 4. Distribution of MDS cases according to hemoglobin levels (N=100).
Anemia was predominantly normocytic (55.6%), followed by macrocytic forms (33.3%) and microcytic forms (11.1%). The reticulocyte count was low in all patients, indicating hyporegenerative anemia, with an average of 40,510/mm3.
Thrombocytopenia was observed in 63% of patients, with a mean platelet count of 62,022/mm3.
Neutropenia was present in 42% of cases, with an average neutrophil count of 909/mm3.
It is worth noting that:
1) 35% of patients had isolated cytopenia (mainly anemia),
2) 36% had bicytopenia, most frequently the combination of anemia and thrombocytopenia,
3) Finally, 29% of patients suffered from pancytopenia (involvement of all three blood cell lines).
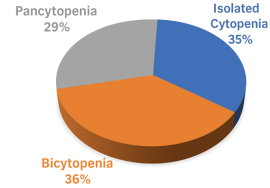
Figure 5. Distribution of MDS according to the presence of one or more peripheral cytopenias (N=100).
(ii). Blood Smear
All patients included in our study underwent a peripheral blood smear. In 95% of cases, this examination revealed morphological abnormalities affecting at least one cell lineage. The main alterations observed were:
1) Dyserythropoiesis, characterized by the presence of poikilocytosis and anisocytosis, found in 97% of patients.
2) Dysgranulopoiesis, manifesting as hyposegmentation and degranulation of granulocytes, observed in 28% of cases.
3) The presence of macroplatelets in some patients with thrombocytopenia.
4) No platelet aggregates were detected on examination of the blood smears.
3.3. Myelogram Abnormalities
In our series, the bone marrow was either hypercellular or normocellular in 85% of cases (n = 85), while a hypocellular marrow was observed in only 15% of patients (n = 15). A predominance of multilineage dysplasia was noted, found in 88% of cases (n = 88), whereas unilineage dysplasia affected only a minority of patients, with a frequency of 12% (n = 12). Among the morphological abnormalities, dyserythropoiesis was the most common, present in 92% of cases (n = 92), followed by dysgranulopoiesis in 65% (n = 65), and dysmegakaryopoiesis in 45% (n = 45).
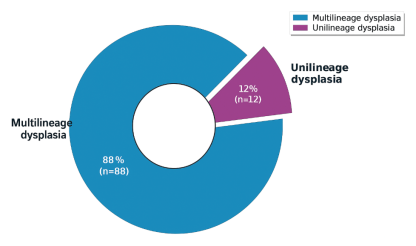
Figure 6. Distribution of MDS According to the Type of Dysplasia Observed.
The average bone marrow blast count was 4.89%. The majority of patients (67%) had a blast percentage below 5%, while 21% had a blast count between 5% and 9%, and 12% had a blast percentage ranging from 10% to 19%. Additionally, Perls' staining was positive in only 8% of the patients included in the series.
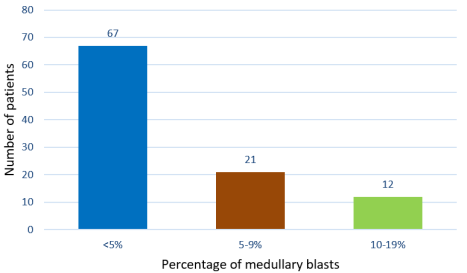
Figure 7. Distribution of MDS According to Bone Marrow Blast Percentage.
2016 WHO Classification:
In our series, the distribution was as follows:
MDS with multilineage dysplasia in 48% of patients (n = 48)
MDS with single-lineage dysplasia in 10% of cases (n = 10)
MDS with excess blasts type 1 in approximately 21% (n = 21)
MDS with excess blasts type 2 in 12% of cases (n = 12)
MDS with ring sideroblasts and multilineage dysplasia in 6% (n = 6)
MDS with ring sideroblasts and single-lineage dysplasia in 2% (n = 2)
MDS with isolated del (5q) in 1% (n = 1)
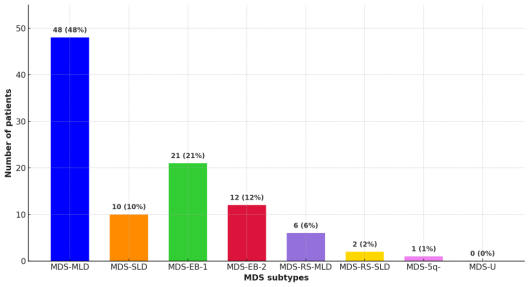
Figure 8. Distribution According to the 2016 WHO Classification.
4. Discussion
4.1. Epidemiological Profil
Our study, conducted between 2018 and 2024 at the Mohammed V Military Teaching Hospital (HMIMV) in Rabat, reported 100 cases of myelodysplastic neoplasms (MDS), corresponding to an average annual frequency of 14.3 cases. This incidence represents a marked increase compared to the study by Maaroufi (7.6 cases/year), likely due to broader coverage and improved detection. Unlike the previous study, our work included all hospital departments, not just clinical hematology (24% of cases originated from other departments).
This increase also reflects advances in diagnostic capacity (cytogenetics, molecular biology) and heightened awareness among clinicians. Compared to other North African series Tunisia (10 cases/year), Algeria (7–8 cases/year) —our frequency remains higher. European countries report significantly greater figures (28 to 41 cases/year), linked to older populations and systematic access to diagnostic testing. These discrepancies may also result from different inclusion criteria, referral pathways, and recruitment biases. The older Japanese series , reporting 6.5 cases/year, highlights temporal and regional variations. Such disparities underscore the need for reliable national registries to accurately estimate the true incidence of MDS.
A tool of this nature is essential for better healthcare planning and resource allocation.
The mean age of patients in our series was 69 years, with no significant difference between males and females.
MDS predominantly affected individuals aged 61 to 80 years, confirming their geriatric nature.
This mean age is comparable to Tunisian data (68 years), and slightly higher than in previous Algerian (5;6) and Moroccan (3) studies. It is markedly higher than averages reported in Casablanca (50.5 years), sub-Saharan Africa , and Asia (46–57 years). European and North American series report even higher mean ages (72–76 years), reflecting older populations. These differences can be attributed to demographic factors, such as life expectancy, which is higher in developed countries. Access to healthcare and earlier diagnosis also influence the age at detection. Environmental or genetic factors may also play a role. The absence of an age difference between sexes is consistent with several Maghreb studies. However, some research has shown earlier onset in women, particularly in Africa and Asia .
In our study, men accounted for 58% of cases, with a male-to-female sex ratio of 1.38, confirming the typical male predominance in MDS. This trend aligns with Maghreb data , which report sex ratios ranging from 1.2 to 1.31, suggesting common regional factors. Internationally, studies from Spain and Japan show similar ratios, often attributed to occupational or environmental exposures more common in men. However, some series, notably from France and Algeria , report a slight female predominance, with no clear explanation. Overall, sex ratios remain close to parity (0.86 to 1.44), suggesting that MDS affects both sexes relatively equally. This supports the concept of a multifactorial pathogenesis, in which sex is not a major risk factor. Our sex ratio, consistent with large published series, reflects an epidemiological profile representative of MDS.
4.2. Myelogram Indications
4.2.1. Clinical Indications
In our series, anemic syndrome was the main reason for consultation, found in 70% of patients. It mainly presented as asthenia, exertional dyspnea, and pallor—early warning signs of MDS. Hemorrhagic (12%), infectious (10%), and tumoral syndromes (3%) were much less frequent. These findings are consistent with both national and international series, where anemia is often reported in over 80% of cases. This predominance is explained by dyserythropoiesis, a frequent and early morphological abnormality in MDS.
4.2.2. Blood Count Abnormalities
In our series, anemia was the predominant cytopenia (90%), exceeding the rates reported by Maaroufi et al. (76%) and Baiza et al. (96%), while thrombocytopenia (63%) and neutropenia (42%) were comparable to their findings. The distribution of cytopenias showed 35% isolated forms, 36% bicytopenias, and 29% pancytopenias—contrasting with Maaroufi et al. (50%, 29%, 21%, respectively), but close to the data from Baiza et al. (34%, 23%, 33%).
Among isolated cytopenias, anemia accounted for 88.6%, in line with Maaroufi et al. (68.4%), confirming its clear predominance. Isolated thrombocytopenia (4%) was rare, and no cases of isolated neutropenia were found—consistent with the literature, where isolated granulocytic involvement is exceptional. The mean hemoglobin level (9 g/dL) was lower than that reported by Maaroufi et al. (10.33 g/dL), but higher than values reported by Samba et al. , Ndiaye et al. (both 4.9 g/dL), and Guezlane et al. (6.5 g/dL), reflecting geographical disparities. These differences may be due to delayed diagnosis, infectious or nutritional comorbidities, and unequal access to healthcare.
Morphologically, normocytic anemia predominated (55.6%), followed by macrocytic (33.3%) and microcytic forms (11.1%) a distribution similar to that reported by Maaroufi et al. (73%, 22%, 13%). This trend is also consistent with Bernard et al. (60% normocytic), Bibi I (48%), and Hmissi B et al. (53%), in contrast with earlier macrocytic-dominated series from Samba, Merlat, and Lowenthal. Historically, macrocytosis was closely associated with MDS due to replication anomalies linked to cellular aging. The current trend toward normocytosis may reflect earlier diagnoses or presentations masked by nutritional deficiencies. The notable presence of microcytosis [11.1%], also observed by Maaroufi et al. (13%), confirms that microcytosis does not exclude MDS. It may result from post-transfusion iron overload or severe dyserythropoiesis. The diversity of anemia forms in MDS illustrates their pathophysiological heterogeneity. These findings highlight the need for a comprehensive diagnostic approach, integrating morphology, cytogenetics, and molecular biology. Finally, inter-study comparisons reveal the impact of clinical, healthcare, and methodological contexts on observed profiles.
Table 1. Cytopenias distribution in different studies.

Study

Anemia (%)

Thrombocytopenia (%)

Neutropenia/Leucopenia (%)

Our study

90.0

63.0

42.0

Maaroufi et al.

76.0

69.0

38.0

Baiza et al.

96.0

44.0

35.0

Bernasconi et al.

56.6

51.3

46.4

Massimo et al.

41.0

31.0

36.0

4.3. Myelogram Abnormalities
In our series, the analysis of morphological abnormalities revealed a predominance of dyserythropoiesis, observed in 92% of patients (n=92), followed by dysgranulopoiesis in 65% of cases (n=65), and dysmegakaryopoiesis in 45% of cases (n=45). These findings are consistent with the literature, which confirms dyserythropoiesis as the most frequent morphological abnormality in myelodysplastic neoplasms (MDS).
Our results are comparable to those reported by other authors: the studies by Ehsan et al., Hmissi et al., and H. Maaroufi reported dyserythropoiesis in 89%, 86%, and 81.02% of cases, respectively . This concordance highlights the importance of dyserythropoiesis as a major diagnostic marker of MDS, reflecting the predominant involvement of the erythroid lineage in this pathology.
Regarding bone marrow blastosis, our study showed a mean blast percentage of 4.89%. The distribution of patients according to blast percentage revealed that 67% had a blast count below 5%, 21% had blastosis between 5% and 9%, and 12% had blast counts ranging between 10% and 19%.
These results are close to those of Maaroufi’s study , which reported 64.5% of patients with blast counts below 5%, 21% with counts between 5% and 10%, 10.5% between 11% and 19%, and only 4% with counts above 20%. This similarity suggests a comparable patient profile in both series, with a predominance of low-blast forms.
However, our results differ from those reported in other international series. The study by Bernasconi et al. reported blast counts below 5% in 58.45% of cases, between 5% and 10% in 12.62%, between 11% and 19% in 18.94%, and over 20% in 9.97% of cases. Similarly, the series by Massimo et al. reported blast counts below 5% in only 41% of cases, between 5% and 10% in 38.7%, between 11% and 19% in 12%, and above 20% in 8% of cases.
These variations may be explained by several factors: patient selection criteria, disease stage at the time of diagnosis, and the demographic characteristics of the studied populations.
The predominance of low-blast forms in our series is a favorable prognostic factor, as these forms are generally associated with better survival outcomes and a lower risk of leukemic transformation.
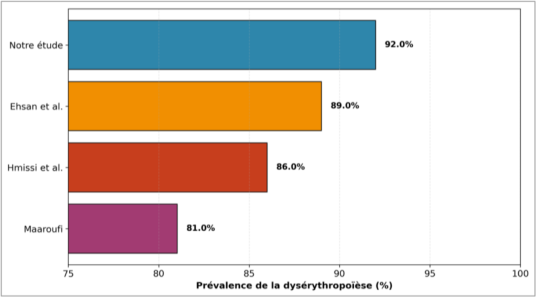
Figure 9. Dyserythropoïesis, most frequent morphological abnormality in MDS: comparison between different studies.
4.4. WHO Classification of MDS
Our study reveals a marked predominance of myelodysplastic neoplasms with multilineage dysplasia (MDS-MLD), accounting for 48% of cases (n=48), which represents nearly half of our cohort. This finding aligns with the pathophysiological concept of MDS as a clonal disease primarily affecting multiple hematopoietic lineages.
The observed distribution highlights a clear hierarchy:
1) Dysplastic forms (58%): MDS-MLD [48%] and MDS-SLD (10%)
2) Forms with excess blasts (33%): MDS-EB1 [21%] and MDS-EB2 (12%)
3) Forms with ring sideroblasts (8%): RS-MLD (6%) and RS-SLD (2%)
4) Pure cytogenetic form: MDS-5q-(1%)
Our finding of a predominance of MDS-MLD is echoed in several other series, such as that of Maaroufi, who reported a frequency of 59% for MDS-MLD, and Iron et al, who noted an even higher proportion, reaching 68%. This convergence suggests that multilineage dysplasia is indeed the most frequent morphological phenotype of MDS, reflecting the widespread involvement of clonal hematopoiesis.
In contrast, the study by Baiza et al. reported only 33% MDS-MLD, significantly lower than our observations. Even more strikingly, studies by Kelaidi et al. and Bernasconi et al. identified MDS-EB1 and MDS-SLD, respectively, as the predominant forms.
5. Conclusion
This retrospective study of 100 cases of myelodysplastic neoplasms (MDS) at the Military Hospital of Rabat highlights the central role of bone marrow examination (myelogram) in diagnosing these hematologic disorders. The analysis reveals a male predominance, an average age of 69 years, and a high prevalence of the MDS-MLD subtype. The increasing incidence of MDS is attributed to the improvement of diagnostic tools. The introduction of cytogenetics and molecular biology enables more precise diagnosis and personalized management. Recent scientific advances have enriched classifications and treatment options, but high-risk cases remain challenging to manage. A national registry is recommended to better allocate resources and harmonize clinical practices.
Abbreviations

MDS

Myelodisplastic Neoplasms

WHO

World Health Organization

HMIMV

Mohammed V Military Teaching Hospital

CBC

Complete Blood Count

MGG

May-Grünwald-Giemsa

MDS-MLD

MDS with Multilineage Dysplasia

MDS-SLD

MDS with Single-lineage Dysplasia

MDS-EB 1

MDS with Excess Blasts Type 1

MDS-EB 2

MDS with Excess Blasts Type 2

MDS-RS-MLD

MDS with Ring Sideroblasts and Multilineage Dysplasia

MDS-RS-SLD

MDS with Ring Sideroblasts and Single-lineage Dysplasia

MDS-5q

MDS with Isolated Del (5q)

MDS-U

MDS Unclassifiabl

Author Contributions
Arrama Hamza: Conceptualization, Resources, Formal analysis, Writing – original draft
Bouchara Arwa: Data curation, Methodology
Conflicts of Interest
The authors declare no conflicts of interest.
References
[1] Hajar S, Zahrae LF, Hicham Y, Mustapha AA, Mohamed C. The Role of Myelogram in Diagnosis of Malignant Hemopathies. Am J Lab Med. oct 2021; 6(5): 70‐6.
[2] Krause H, Manz MG, Gerber B. Syndrome myelodysplasique: physiopathologie, diagnostic et traitement. Forum Medical Suisse ‒ Swiss Medical Forum [Internet]. 2013 [cited 16 juin 2025]; 13. Disponible sur:
[3] Maaroufi HE, Ababou M, Hammani A, Ahchouch S, Jennane S, Mahtat M, et al. Prise en charge des syndromes myelodysplasiques au Maroc à propos d ́une etude mono- centrique. Pan Afr Med J. 2 dec. 2020; 37: 300.
[4] Hanane M, Ilham K, Zahir H, Hicham Y, Mustapha AA, Mohammed C. Myelodysplastic Syndromes Experience of the Laboratory of the Military Hospital Avicenna Marrakech. Am J Lab Med. dec. 2019; 4(6): 115‐8.
[5] Masson E. EM-Consulte. [cite 2 juill. 2025]. Manifestations immunes associees aux syndromes myelodysplasiques. Etude prospective de 40 patients. Disponible sur:
[6] Seguier J. Manifestations auto-immunes associees aux syndromes myelodysplasiques: description d’une cohorte regionale et revue de la litterature. 2017;
[7] Troussard X, Malet M, Duchenet V, Mouchel D, Cheze S, Collignon A. Epidemiologie des syndromes myelodysplasiques (SMD) et des syndromes myelodysplasiques/syndromes myeloproliferatifs (SMD/SMP): Experience du Registre regional des hemopathies malignes de Basse-Normandie. Revue Francophone des Laboratoires. 1 juin 2009; 2009 [413]: 25‐9.
[8] Bernasconi P, Klersy C, Boni M, Cavigliano PM, Calatroni S, Giardini I, et al. World Health Organization classification in combination with cytogenetic markers improves the prognostic stratification of patients with de novo primary myelodysplastic syndromes. Br J Haematol. mai 2007; 137(3): 193‐205.
[9] Germing U, Strupp C, Kündgen A, Bowen D, Aul C, Haas R, et al. No increase in age-specific incidence of myelodysplastic syndromes. Haematologica. août 2004; 89(8): 905‐10.
[10] Navarro I, Ruiz MA, Cabello A, Collado R, Ferrer R, Hueso J, et al. Classification and scoring systems in myelodysplastic syndromes: a retrospective analysis of 311 patients. Leuk Res. août 2006; 30(8): 971‐7.
[11] Difference in clinical features between Japanese and German patients with refractory anemia in myelodysplastic syndromes - PubMed [Internet]. [cite 2 juill. 2025]. Disponible sur:
[12] Mesli PN. Les syndromes myelodysplasiques en milieu hospitalier.
[13] Baiza N, Bellamine K, Gamraoui k. Les syndromes myelodysplasiques: à propos de 45 cas. Hematologie. 2011; 17 [1]: 168.
[14] Ma X, Does M, Raza A, Mayne ST. Myelodysplastic syndromes: incidence and survival in the United States. Cancer. 15 avr. 2007; 109(8): 1536‐42.
[15] Dinmohamed AG, Visser O, van Norden Y, Huijgens PC, Sonneveld P, van de Loosdrecht AA, et al. Trends in incidence, initial treatment and survival of myelodysplastic syndromes: a population-based study of 5144 patients diagnosed in the Netherlands from 2001 to 2010. Eur J Cancer. mars 2014; 50(5): 1004‐12.
[16] Ehsan A, Aziz M. Clinico-haematological characteristics in Pakistani patients of primary myelodysplastic syndrome according to World Health Organization classification. J Coll Physicians Surg Pak. avr. 2010; 20 [4]: 232‐6.
[17] Samba Diago N. Aspects cytologiques des syndromes myelodysplasiques au Senegal. Science Lib Editions Marsenne. 2009; 2 (90902).
[18] Ben Amor I, Mnif H, Kassar O, Bouaziz H, Rekik H, Mseddi S et al. Immunisation anti-erythrocytaire dans les syndromes myelodysplasiques: etude à propos de 53 patient.
[19] Ndiaye Fatou, Samba Diego, Toure-Fall Awa Oumar, Fall Seynabou, Ka Mamadou Mourtalla, Moreira-Diop Therèse. Aspects cytologiques des syndromes myelodysplasiques au Senegal: etude retrospective de 13 patients. Science Lib Editions Mersenne. 2009; Volume 2(N° 090902).
[20] Syndromes myelodysplasiques et leucemies secondaires: generalites, diagnostic et classification - EM consulte [Internet]. [cite 2 juill. 2025]. Disponible sur:
[21] Myelodysplastic syndromes in Thailand: a retrospective pathologic and clinical analysis of 117 cases - PubMed [Internet]. [cite 2 juill. 2025]. Disponible sur:
[22] Groupe Francophone des Myélodysplasies, “Référentiel SMD du GFM Octobre 2008”. Available from:
[23] Les syndromes myelodylasiques (A propos de 34 cas) [Internet]. [cite 2 juill. 2025]. Disponible sur:
[24] Hmissi B, Gouider E, Ben Salah N, El Borgi W, Besbes S et al. Profil epidemiologique, cytologique des syndromes myelodysplasiques: experience de l ́hopital Aziza Othmana.
Cite This Article
  • APA Style

    Hamza, A., Arwa, B., Youssef, L., Youssef, D., Ilham, O., et al. (2026). The Role of Myelogram in the Diagnosis of Myelodysplastic Neoplasms. European Journal of Clinical and Biomedical Sciences, 12(2), 17-26. https://doi.org/10.11648/j.ejcbs.20261202.11

    Copy | Download

    ACS Style

    Hamza, A.; Arwa, B.; Youssef, L.; Youssef, D.; Ilham, O., et al. The Role of Myelogram in the Diagnosis of Myelodysplastic Neoplasms. Eur. J. Clin. Biomed. Sci. 2026, 12(2), 17-26. doi: 10.11648/j.ejcbs.20261202.11

    Copy | Download

    AMA Style

    Hamza A, Arwa B, Youssef L, Youssef D, Ilham O, et al. The Role of Myelogram in the Diagnosis of Myelodysplastic Neoplasms. Eur J Clin Biomed Sci. 2026;12(2):17-26. doi: 10.11648/j.ejcbs.20261202.11

    Copy | Download

  • @article{10.11648/j.ejcbs.20261202.11,
      author = {Arrama Hamza and Bouchara Arwa and Loubadi Youssef and Dakki Youssef and Orchi Ilham and Essahli Khadija and Kahouli Sophia and Zahid Hafid},
      title = {The Role of Myelogram in the Diagnosis of Myelodysplastic Neoplasms},
      journal = {European Journal of Clinical and Biomedical Sciences},
      volume = {12},
      number = {2},
      pages = {17-26},
      doi = {10.11648/j.ejcbs.20261202.11},
      url = {https://doi.org/10.11648/j.ejcbs.20261202.11},
      eprint = {https://article.sciencepublishinggroup.com/pdf/10.11648.j.ejcbs.20261202.11},
      abstract = {Myelodysplastic syndromes (MDS) constitute a heterogeneous group of clonal hematopoietic stem cell disorders, characterized by ineffective hematopoiesis, peripheral cytopenias, and a risk of progression to acute leukemia. We report the results of a retrospective descriptive study of 100 MDS cases diagnosed at the hematology laboratory of HMIMV in Rabat over a 7-year period (January 2018 to December 2024), using a standardized data collection form for epidemiological, clinical, and biological data. The main objective of this work was to analyze the diagnostic contribution of bone marrow examination in MDS, specifying its indications and the main abnormalities observed. The mean age at diagnosis was 69 years (range: 41-93 years), with a moderate male predominance (sex ratio = 1.38). Clinically, anemic syndrome was the most frequent presenting manifestation (70%), followed by hemorrhagic manifestations (12%) and infectious manifestations (10%). Biological analysis revealed anemia in 90% of patients (mean hemoglobin: 9 g/dL), thrombocytopenia in 63% of cases, and leukopenia in 42% of cases. The anemia was normocytic in 55.6% of cases, macrocytic in 33.3%, and microcytic in 11.1%. Bone marrow examination revealed dyserythropoiesis in 92% of patients, dysgranulopoiesis in 65% of cases, and dysmegakaryopoiesis in 45% of cases. The median percentage of bone marrow blasts was 4.89%. According to the 2016 WHO classification, MDS-MLD were the most frequent (48%), followed by MDS-EB1 (21%) and MDS-EB2 (12%). The results of this study are consistent with national and international literature data, confirming the central role of bone marrow examination in MDS diagnosis and highlighting the importance of a multidisciplinary approach for optimal management of these complex hematological malignancies.},
     year = {2026}
    }
    

    Copy | Download

  • TY  - JOUR
    T1  - The Role of Myelogram in the Diagnosis of Myelodysplastic Neoplasms
    AU  - Arrama Hamza
    AU  - Bouchara Arwa
    AU  - Loubadi Youssef
    AU  - Dakki Youssef
    AU  - Orchi Ilham
    AU  - Essahli Khadija
    AU  - Kahouli Sophia
    AU  - Zahid Hafid
    Y1  - 2026/03/23
    PY  - 2026
    N1  - https://doi.org/10.11648/j.ejcbs.20261202.11
    DO  - 10.11648/j.ejcbs.20261202.11
    T2  - European Journal of Clinical and Biomedical Sciences
    JF  - European Journal of Clinical and Biomedical Sciences
    JO  - European Journal of Clinical and Biomedical Sciences
    SP  - 17
    EP  - 26
    PB  - Science Publishing Group
    SN  - 2575-5005
    UR  - https://doi.org/10.11648/j.ejcbs.20261202.11
    AB  - Myelodysplastic syndromes (MDS) constitute a heterogeneous group of clonal hematopoietic stem cell disorders, characterized by ineffective hematopoiesis, peripheral cytopenias, and a risk of progression to acute leukemia. We report the results of a retrospective descriptive study of 100 MDS cases diagnosed at the hematology laboratory of HMIMV in Rabat over a 7-year period (January 2018 to December 2024), using a standardized data collection form for epidemiological, clinical, and biological data. The main objective of this work was to analyze the diagnostic contribution of bone marrow examination in MDS, specifying its indications and the main abnormalities observed. The mean age at diagnosis was 69 years (range: 41-93 years), with a moderate male predominance (sex ratio = 1.38). Clinically, anemic syndrome was the most frequent presenting manifestation (70%), followed by hemorrhagic manifestations (12%) and infectious manifestations (10%). Biological analysis revealed anemia in 90% of patients (mean hemoglobin: 9 g/dL), thrombocytopenia in 63% of cases, and leukopenia in 42% of cases. The anemia was normocytic in 55.6% of cases, macrocytic in 33.3%, and microcytic in 11.1%. Bone marrow examination revealed dyserythropoiesis in 92% of patients, dysgranulopoiesis in 65% of cases, and dysmegakaryopoiesis in 45% of cases. The median percentage of bone marrow blasts was 4.89%. According to the 2016 WHO classification, MDS-MLD were the most frequent (48%), followed by MDS-EB1 (21%) and MDS-EB2 (12%). The results of this study are consistent with national and international literature data, confirming the central role of bone marrow examination in MDS diagnosis and highlighting the importance of a multidisciplinary approach for optimal management of these complex hematological malignancies.
    VL  - 12
    IS  - 2
    ER  - 

    Copy | Download

Author Information
  • Hematology and Immunohematology Laboratory, Mohammed V Military Teaching Hospital, Rabat, Morocco;Faculty of Medicine and Pharmacy of Rabat, Mohammed V University of Rabat, Rabat, Morocco

  • Hematology and Immunohematology Laboratory, Mohammed V Military Teaching Hospital, Rabat, Morocco;Faculty of Medicine and Pharmacy of Rabat, Mohammed V University of Rabat, Rabat, Morocco

  • Hematology and Immunohematology Laboratory, Mohammed V Military Teaching Hospital, Rabat, Morocco;Faculty of Medicine and Pharmacy of Rabat, Mohammed V University of Rabat, Rabat, Morocco

  • Faculty of Medicine and Pharmacy of Rabat, Mohammed V University of Rabat, Rabat, Morocco

  • Hematology and Immunohematology Laboratory, Mohammed V Military Teaching Hospital, Rabat, Morocco

  • Hematology and Immunohematology Laboratory, Mohammed V Military Teaching Hospital, Rabat, Morocco

  • Hematology and Immunohematology Laboratory, Mohammed V Military Teaching Hospital, Rabat, Morocco;Faculty of Medicine and Pharmacy of Rabat, Mohammed V University of Rabat, Rabat, Morocco

  • Hematology and Immunohematology Laboratory, Mohammed V Military Teaching Hospital, Rabat, Morocco;Faculty of Medicine and Pharmacy of Rabat, Mohammed V University of Rabat, Rabat, Morocco